Summary by Dr. Alex Street, astreet@carroll.edu
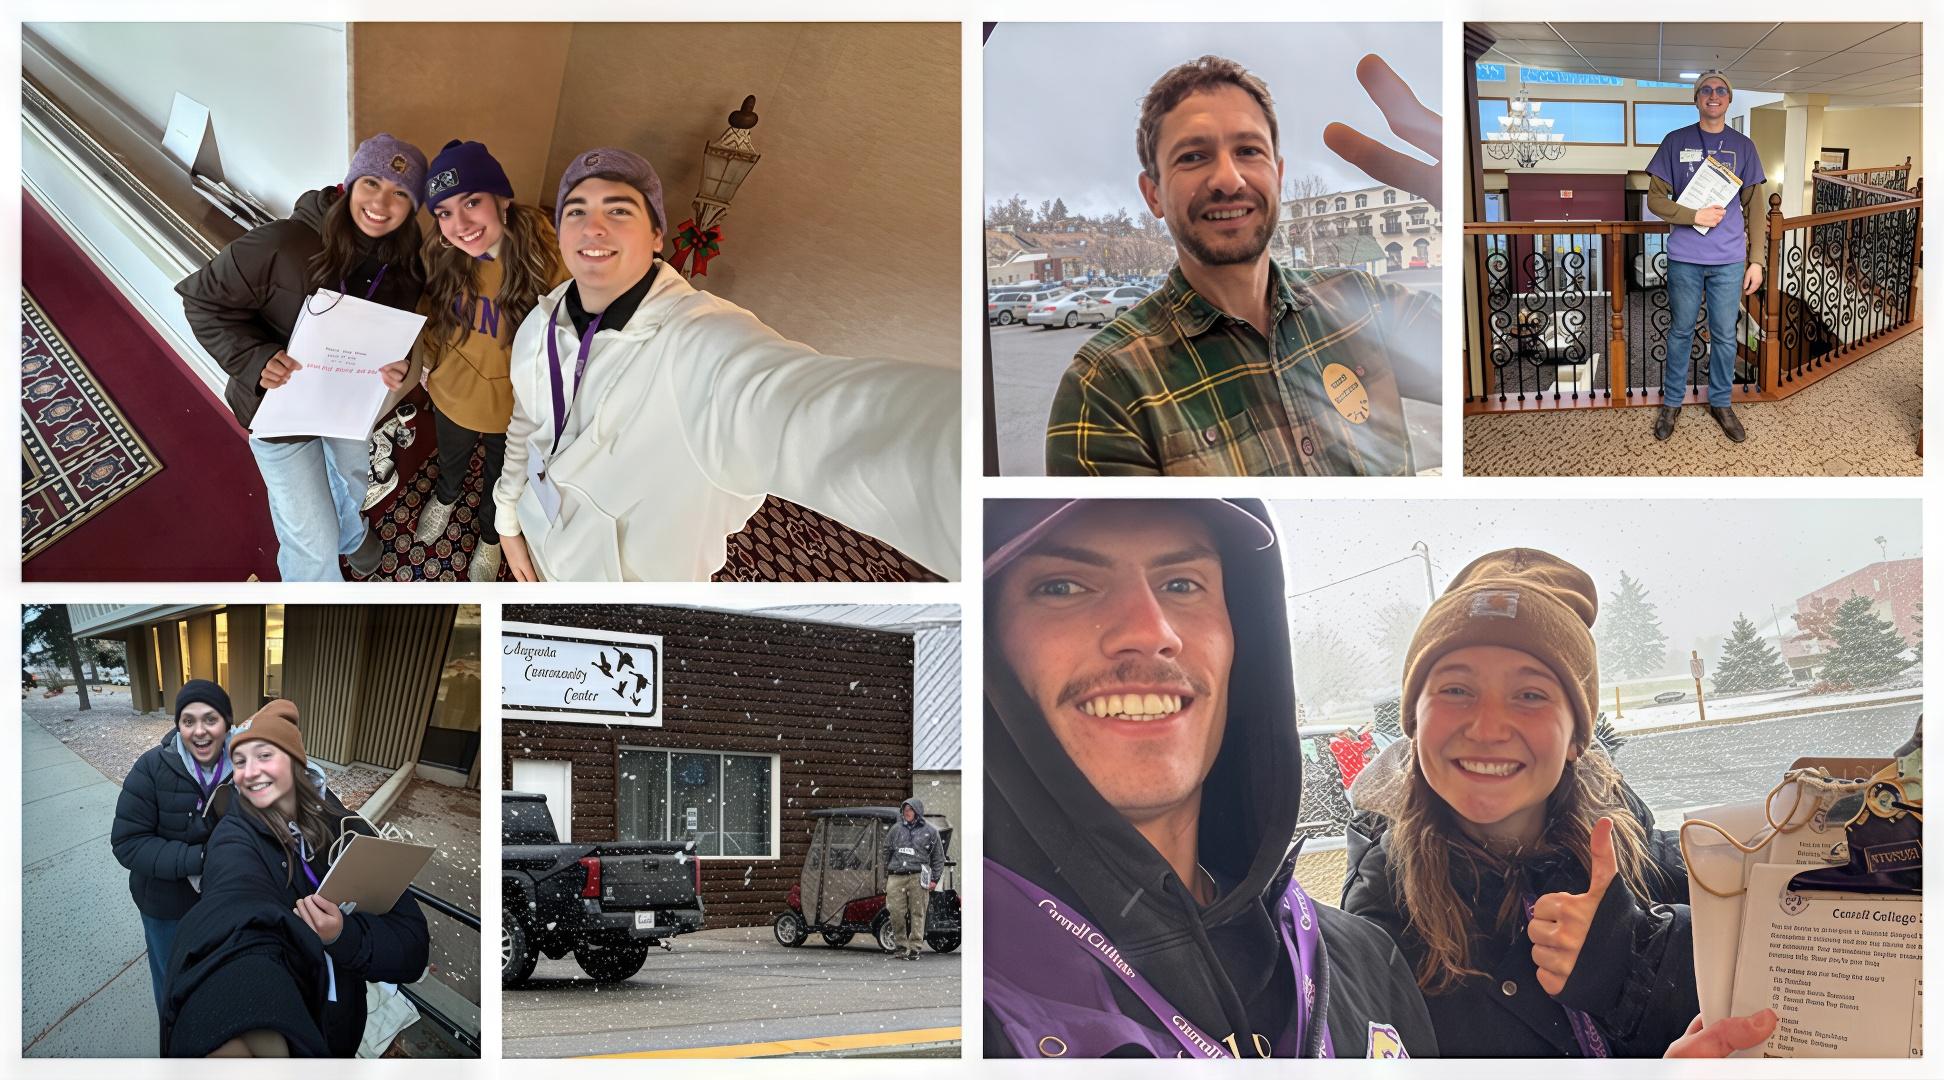
(Helena, MT) As has been done since 2014, Carroll College political science students once again designed and conducted an election poll for the 2024 general election. This year, students carried out an in-person exit poll at randomly selected locations across Lewis and Clark County on November 5, 2024. The exit poll gathered a sample of 816 voters and yielded representative results; for example, 54% of respondents were voting for Jon Tester compared to 52% in the official county tally. Additionally, students distributed 900 mail-in surveys to Park County, MT, achieving a response rate of 19%. Park County was chosen for its alignment with statewide averages in the 2020 election. However, responses to this year’s mail survey were skewed toward more educated and Democratic-leaning voters, compared to the overall county demographics and election results.
Carroll College extends its heartfelt gratitude to the hundreds of Montanans who participated in this research. This report highlights some of the key findings, focusing on several intriguing patterns observed. For this summary, the analysis relies on data from the Lewis and Clark County sample. Additional details are available upon request.1
1. Negative campaigns, negative votes?
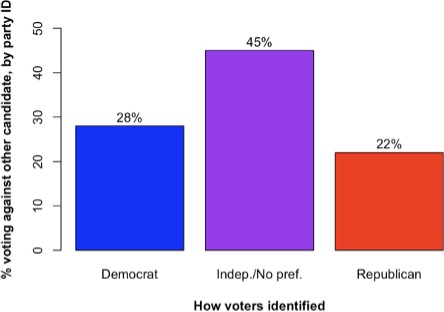
The 2024 Presidential election, in particular, featured two candidates who engaged in harsh personal attacks. Many Americans see the country as deeply divided between supporters of political parties who deeply dislike those on the other side. To measure the extent of negative voting, students asked survey respondents, “Would you say your choice in the Presidential election is more a vote FOR your chosen candidate or AGAINST the other?” They also asked, “Regardless of how you voted today, do you tend to think of yourself as a Democrat, Republican, Independent, or No preference?” They found that it is actually the self-identified Independents (about 30% of respondents), and those who express No preference (another 10% of respondents) who were most likely to say that they voted against rather for a candidate. Only around a quarter of those who identify with a political party said they voted “more against,” compared to nearly half of the Independent/No preference voters. This pattern is illustrated in Figure 1, below.
1They will post the data by the end of 2024 on the following page, where data from earlier years are also publicly available: https://scholars.carroll.edu/collections/bf2904c2-4975-4205-8aee-84a69d041d57


